Building a flexible Enterprise Architecture / by Dirk Stähler and Nadja Möller (LEONI)
How a Knowledge Graph supports LEONI’s transformation
The automotive supplier LEONI uses a Knowledge Graph based on open-source products to control enterprise-wide transformation and the integration of various corporate architecture content.
Automotive suppliers are currently under considerable pressure to transform – driven by forces such as vehicle networking, automated driving, electrification of the powertrain as well as digitalization and CO2 minimization. New studies show that suppliers must initiate comprehensive change. To control this, it is necessary to understand the relationships between business, physical systems, information and many more. It is necessary to gain an overview of the company’s technology architecture at all times.
As a global provider of products, solutions and services for energy and data management in the automotive industry LEONI is currently undergoing an extensive transformation in its Wiring Systems Division. The automotive supplier has initiated a wide range of activities to increase operational efficiency. It is important for the responsible people involved to be at all times informed about the effects and interdependencies of individual transformation projects. Only then it is guaranteed that every optimization activity is in line with the company’s strategy and will create a sustainable improvement in operational value generation. This requires to merge information from different perspectives. In the future, LEONI will gain this flexibly by using a Knowledge Graph. In the center it is based on a corporate model that makes it possible to provide information for decision support with high accuracy, and as “additional bonus” it is based largely on license-free software.
Why classic Enterprise Architectures are no longer sufficient
Enterprise Architectures have been used in the private and public sector for many years to increase efficiency, to support standardization, to increase transparency and continuously improveme the organization with the help of a solid information base. To document the information mostly specialized frameworks and notations (e.g. Zachman, TOGAF, ArchiMate, BPMN) are used. They provide systematic frameworks for the management and optimization of business processes, organizational structures as well as data and IT architectures.
But often different teams and projects use a variety of frameworks and software products in parallel to capture and document content. This results in heterogeneous islands of information that – in the best case – “only” create extra work, in the worst case (and this is more often) lead to inconsistencies between the different datasets. If in a dynamic environment information from such sources must be merged these approaches fail to provide quick answers for complex questions. Examples are compliance requirements that include the connection of data security and business process content, but are kept in independent tools. This classic documentation approach of a corporate architecture isn’t flexible, requires greater effort to incorporate additional sources of information and does not allow ad-hoc analyzes on a common dataset.
To address this problem, LEONI has begun to provide decision-relevant information based on an integrated Knowledge Graph obtained by Computer Aided Structure and Semantic Analysis (CASSA) methods. CASSA is the computer-aided generation of a knowledge graph, which allows linked analyzes to be created on heterogeneous data sources without extensive methodological and technical integrations. The graph is based on an open data structure that makes it possible to store and integrate content in a flexible data pool – without conflicts.
In this way, LEONI avoids the weak points of the classic approach. That includes in particular the following topics:
1) Content – from a global to a project-related view
Today projects are the primary sources of content for Enterprise Architecture Management and essentially control its orientation. Only if the agile requirements of projects are supported, the Enterprise Architecture provides a valuable contribution. For LEONI this means that individual and project specific questions regarding the transformation of the organization needs to be answered flexible and quickly, without the requirement to integrate the data sources in advance.
2) Detailing – from rigid to a flexible methodology
Architecture documentations created following a fixed specification are no longer state of the art and are more and more repressed by flexible approaches with individual levels of detail. For LEONI this creates the requirement that the approach needs to provide the flexibility to be easily supplemented with project-specific content. Through this LEONI ensures that new content can be integrated with minimal effort into the existing architecture.
3) Topology – from islands to a network
Due to the focus on project-specific content the architecture management is transformed from a creator of content into an integrator of organizational knowledge. In the future, the focus will be more on connecting multiple sources of information rather than the creation of individual “islands of truth”. For LEONI this means setting up the overall architecture as flexible as possible so that currently independent sources of information are connected and – where appropriate – are available for analysis without duplicates.
4) Description – from graphical to abstract representation
The abstract and notation-neutral consolidation of content in one model efficiently combines architectural knowledge. The aim is to separate representation (notation) and content completely. This simplifies the setup, maintenance and analysis of an Enterprise Architecture. LEONI transfers the content provided within different notations into a notation-neutral overall picture. This creates a corporate model that describes the semantic relations, free from the restrictions that come with notation-specific graphic visualizations.
5) Collection – from manual to automatic information collection
Automatic procedures for collecting, processing and storing architectural knowledge support the complex process of collecting and consolidating information in the long term. This is currently not yet implemented at LEONI. However, the notation-neutral knowledge graph opens up the possibility of automatically integrating content into the system in the future and will further reduce the effort required to collect data.
6) Visualization – from modeling to generating
Graphical visualizations are generated based on an abstract model and are no longer manually designed. The integrated Knowledge Graph allows LEONI to create graphic visualizations for communicating the corporate architecture findings without “drawing” them for each individual use case. It is no longer efficient to have employees create diagrams manually with a lot of effort. Rather, impressive representations can be flexibly generated with the help of computers.
7) Tools – from suites and best-of-breed to hub and spoke
Schema-less graph databases and analysis tools allow the individual and flexible connection of architectural content, more specific evaluations and make it easier to communicate results. LEONI will continue to use individual tools in the future to solve specific tasks. Special solutions for the management of process, data, organizational or application content will continue to exist. However, it is important to integrate each of these sources as much as possible with little effort. Only then they can provide an overarching comprehensive and consistent added value. For this specific task LEONI uses an open-source graph database for storing the Knowledge Graph.
A detailed explanation of how the above listed topics help to create a modern Enterprise Architecture can be found in the article “7 steps towards a modern Enterprise Architecture”. Methods of Computer Aided Structure and Semantic Analysis (CASSA) support LEONI to build this modern form of corporate architecture. But how is the associated Knowledge Graph created, kept up to date in the long term and where to start? LEONI has answered these questions.
The primary components of an integrated Knowledge Graph
In general, a Knowledge Graph is a structured representation of the relationships between entities and concepts from various areas (business and technology). Two well-known representatives of a Knowledge Graph are the Facebook relationship network or the Google Knowledge Graph. With the latter, the search engine provides additional information beside search results in an info box (e.g. about places, people, companies). The basis for deriving linked content is a Knowledge Graph. It represents semantic relationships between the entities in the (subject) areas. The result is a network of linked information. Figure 1 shows a simplified structure of a Knowledge Graph and its relationships as simplified example.
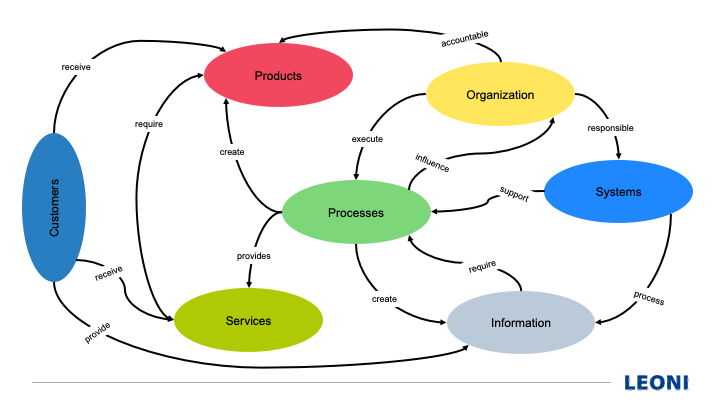
By linking the entities, it is possible to gain a comprehensive understanding of the content and its dependencies. In many cases, sophisticated queries to analyze and evaluate the content can only be realized based on these connections. The essential parts of a Knowledge Graph for an Enterprise Architecture can be structured as follows:
- Services
Services describe the results of a human activity or a technical process. The creation or provision of a service is triggered by the needs of a human person, an organization or a system. - Domains
Domains describe groups in which content is summarized that is involved in the provision of services. - Systems
Systems describe components that are used to deliver services. - Business processes
Business processes describe the sequential flow of activities within a system that are required to carry out the provision of service. - Organizational structures
Organizational structures describe the organizational subjects that are (direct or indirect) involved in the execution of processes. - Information
Information describes knowledge that is required by an actor in a specific situation of service provision.
A detailed description of the above listed parts of an Enterprise Architecture Knowledge Graph can be found in the article “Framework for construction an enterprise architecture” (currently only available in German).
By linking this content within a Knowledge Graph several advantages are realized:
Data integration and contextualization:
Knowledge Graphs provide a framework for the integration and unified communication of content from different areas. By establishing relationships between entities, they create a deeper understanding of underlying concepts and context.
Representation of connections:
Knowledge Graphs allow to capture complex relationships between entities. They can represent different types of relationships, such as hierarchical, temporal, spatial, causal and semantic relations. This creates a comprehensive representation of underlying knowledge and facilitates expended queries and analysis.
Improved evaluations:
Knowledge Graphs allow semantic searches and make finding information snippets significantly easier as relevant information is linked by relationships and context. Their network-like structure enables efficient navigation within interconnected data. This promotes an understanding of connections that are generally not recognizable in a conventional documentation.
Knowledge enrichment and inference:
Knowledge Graphs allow an easy integration of different content because they can be linked with other information sources such as ontologies, taxonomies or other data sets. This enrichment increases the quality and depth of the available information. In addition, they support implicit knowledge to be discovered by inference and can generate new connections based on existing links.
Scalability and Flexibility:
Knowledge graphs can scale horizontally as new data is added. They provide flexibility to adapt to evolving data structures and requirements. New entities, relationships and attributes can be integrated so that they are suitable for dynamically developing areas. On top of this, Knowledge Graphs allow the combination of descriptive models with operational content from real process instances (e.g. determined by process mining). Describing an Enterprise Architecture with a Knowledge Graph helps to use connected information, uncover hidden connections, increase transparency and improve decision-making processes. They provide the ideal construct to build an integrated Enterprise Architecture model.
The initial structure of the LEONI Knowledge Graph
At LEONI, the starting point for setting up the Knowledge Graph was the content of an existing Business Process Model, which is based on the modeling tool BIC Process Design from GBTEC Software AG. This tool offers various notations (including BPMN, DMN and Value Chains) to represent some – but by far not all – required dimensions of an Enterprise Architecture. But through the structured recording of business processes including organizational structure and information connections there was already an initial framework for the Knowledge Graph available. It should be mentioned that for the initial structure of a knowledge graph – in addition to the tool used by LEONI – basically any model-based tool (e.g. LeanIX, SAP Signavio or BOC Adonis) can be used. The aim of this approach is to gain the flexibility to combine different data sources in a tool-neutral manner.
The need for this flexibility is evident – as in almost every large organization – also at LEONI. Various tools are used to create content that is relevant for the integrated Enterprise Architecture. The reason for this is that usually one tool alone is not enough to effectively provide all the relevant capabilities to documented the different content types. Especially in an agile world, where often project-specific tools are used.
When building the Knowledge Graph, it must therefore be guaranteed that different sources of information can be integrated with minimal effort and from almost every data format. No matter whether it is about business process descriptions, textual documentation in Wikis, content from ticket systems, operational ERP or ITSM content and other information obtained via APIs. Everyone knows the countless Excel lists in which decision-relevant knowledge is buried and an overall picture can only be obtained by “painful” manual work.
Technically, it is therefore advisable to choose an approach that allows to integrate content independent of tool-specific notations. LEONI achieves this goal by mapping the Knowledge Graph in the form of a property graph. In a property graph, nodes represent objects (e.g. products, roles, processes), while the connections represent relationships between nodes. Properties can be assigned to each node and connection as key value combination and contain additional information. Through this approach it is possible to capture relevant content without necessarily having to adopt the parts of the source data that are required for visual representation.
This approach significantly simplifies the construction of an integrated Enterprise Architecture. LEONI generates the initial property graph based on the data derived from the mentioned process modeling tool BIC Process Design, directly within a graph database. This delivers a solid basic framework, which builds the center of the Knowledge Graph as hub-and-spoke concept. Additional content can be flexibly added at any time. The path taken by LEONI to build the basic Knowledge Graph is particularly recommended in cases where content is already available in business process management tools. Figure 2 shows the required steps from obtaining the starting content to create the central repository based on the Graph database Neo4j.
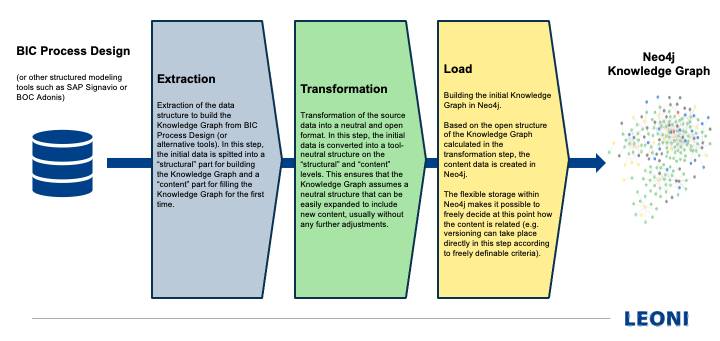
The Neo4j graph database used by LEONI allows the combination of content provided by BIC Process Design to be combined in any scenario. This is achieved because graph databases manage highly linked data in a natural way without complicated relational constructs. Creating a Knowledge Graph in Neo4j is significantly easier and more meaningful than in relational databases, while at the same time providing flexibility in terms of extensions or adjustments. In particular the capability to simply adjust the graph is of importance for the structure of the LEONI Knowledge Graph, as it is almost impossible to predict in advance which information needs to be integrated in the future. Tools used for special tasks, such as modeling business processes, can usually only offer this flexibility at high costs and with individual customizations. By connecting modeling tools with a graph database, this limitation is resolved at minimal costs. The modeling tool provides the (initial) data and the graph database ensures the flexibility at any time without disrupting the fundament.
Dynamic expansion of the knowledge graph
Neo4j makes it possible to persist the Knowledge Graph permanently and enrich it virtually with new content at runtime. This allows a flexible and cost-effective realization of a “query machine” to search for answers on strategic and operational questions, even on an ad hoc basis. Newly added content can be linked with existing content without having to make any adjustments to the supplying tools. Figure 3 shows the expansion of the initial Knowledge Graph with data from different sources based on the schema-less approach.
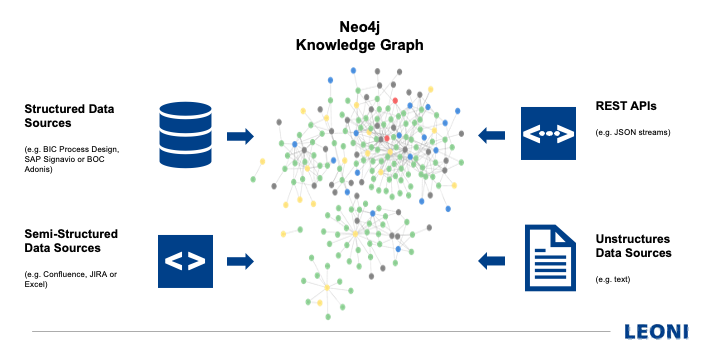
The graph database offers turn-key interfaces and connectors to link various data sources. This makes it possible to compare the content of the data providing sources and to improve the quality of the integrated model by eliminating duplicates or inconsistencies with minimal effort.
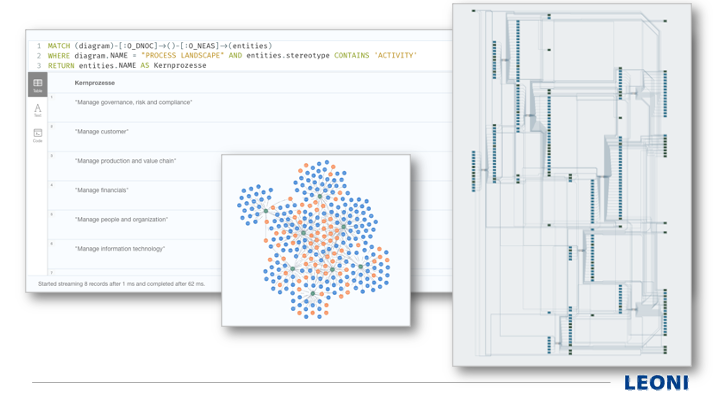
The Neo4j Knowledge Graph is accessed using the standardized graph query language Cypher. It is irrelevant which source initially delivered the content. For users of the Knowledge Graph, the data is always presented in a uniform structure that is always queried using a standardized language. The result is a flat learning curve for using the Knowledge Graph (persist, analyze or modify). Users only need to know one language and no longer have to familiarize themself with different tools or manually integrate data. Figure 4 shows an exemplary Cypher query for querying the content of the LEONI process map and its graphic visualization. It should be mentioned that for query and visualization in Neo4j the same Cypher command is used.
What is particularly interesting is that Neo4j also provides additional functionality to access content remotely via API endpoints. For example, it is possible to access web APIs via low-code queries directly from the Knowledge Graph. Supported are protocols to extract data via https, Amazon s3, Apache Hadoop HDFS, Google GS and a few more. This allows to connect extensive data sources such as data lakes easily into the Knowledge Graph at runtime.
Analyzes based on the knowledge graph
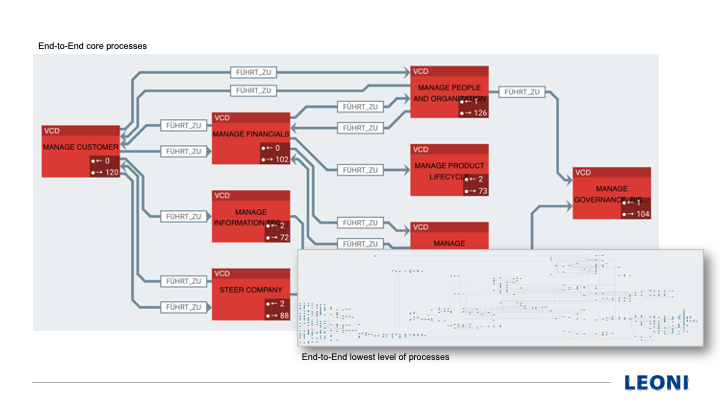
The outstanding performance of a graph database becomes visible when insights are derived based on linked content that could only be evaluated with great effort or not at all without an integrated Knowledge Graph. For example, the LEONI Knowledge Graph makes it possible to automatically generate and visualize aggregated End-to-End evaluations based on the existing BPMN process flows without additional modeling effort. End-to-End processes refer to complete sequence of activities or operations that span the entire lifecycle starting at a process initiator up to the process customer. They describe all the steps required from start, over execution to the provision of a final product or service, including the resources involved. To achieve this, sub-processes, their inputs, work steps, outputs and interactions with various participants or components typically have to be viewed as a whole. Compiling the required content in large organization efficiently is almost impossible without computer support. Not even through the use of a process modeling tool, because they require manual creation as well. A Knowledge Graph and the algorithmic capabilities of the graph database help to overcome this limitation.
For the End-to-End calculation LEONI uses relationships persisted in the database as well as virtual links created at runtime, which are derived based on Natural Language Processing (NLP). Neo4j already offers various standard algorithms in the area of semantic object comparison by using language and object analysis models. This makes it possible to visualize relations that are not recognized at first glance as belonging together (e.g. automatically identifying process interfaces even if the names of the associated end and start events do not reveal a direct connection). Figure 5 shows two generated End-to-End diagrams. The larger picture shows a representation of the highest abstraction level of the End-to-End connections within the LEONI core processes and at the bottom right a detailed representation of the deepest modeling level of the detailed business processes. Both representations are automatically generated and graphically arrange from the Knowledge Graph without additional modeling. Due to the interlinked content, it is possible to derive analyzes in any desired level of detail directly from the existing model without further manual modeling work.
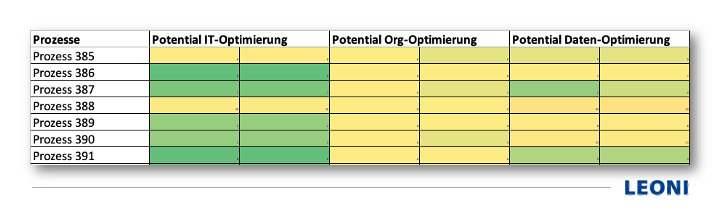
The Neo4j Graph Data Science Library also provides a variety of algorithms that help to answer strategic and operational questions. Figure 6 shows a neutralized section of a heat map created based on the LEONI Knowledge Graph. Visualized are business processes and algorithmically determined optimization areas from an IT, organizational and data perspective. The analysis is based, among other things, on betweenness centrality. Betweenness centrality is a way to determine the influence of a node on the flow of information in a graph. It is often used to find nodes that serve as a bridge from one part of a graph to another. The algorithm calculates shortest paths between all pairs of nodes in a graph. Each node receives a score based on the number of shortest paths that pass through the node. Nodes that lie more frequently on shortest paths between other nodes have higher betweenness centrality values.
Each node receives a score that makes it possible to mathematically identify weak spots within the corporate architecture. The improvement potential is visualized with different colors according to their score. The calculation is carried out entirely on the basis of algorithms implemented in the database without additional programming or modeling. Of course, an interpretation of the results is still necessary afterwards, but the analysis provides a significant time advantage in terms of business and technical process optimization. Through visualization using a heat map, potential areas can be identified and communicated easily.
Evaluation and communication
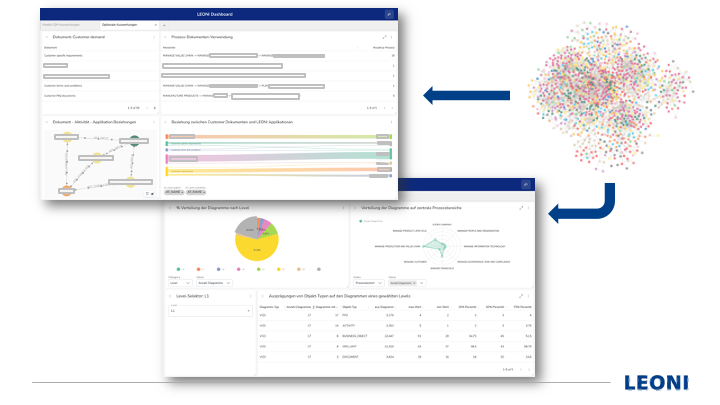
The heat map listed above leads to another aspect that can be easily solved with an integrated Knowledge Graph: reporting and visualization. In order to communicate the insights with a wide range of stakeholders, clear presentation is crucial. With NeoDash as open-source extension of the Neo4j database, it is possible to create interactive dashboards including tables, graphics, bar charts, line charts, maps and more.
Thanks to the close integration with the database, content can be prepared and published specifically for individual target groups. The analyzes based on the Cypher query language presented in the previous sections can be used directly to generate a dashboard, which is why there is very little additional effort for visual representation. It is therefore easy to dynamically communicate both detailed and aggregated information via the dashboard. The possible target groups range from administrators of the source data tools (e.g. by providing a dashboard to check the correct modeling of a business process model used as input in BIC Process Design) over the display of technical content for operational employees (e.g. turtle visualizations of aggregated processes) up to aggregated cockpits for top-level management. Figure 7 shows an excerpt of the statistical and operational evaluations in the LEONI dashboard.
In addition to the dashboard, all content can be visualized graphically. The described separation of content and presentation proves its usefulness at this point. Because all Enterprise Architecture data is available in the database as a notation-neutral network, it is possible to calculate any combination of representation at runtime. For example, the flow diagrams of the End-to-End relationships in Figure 5 are created and graphically arranged completely automatically. No manual modeling work required.
This makes it possible to easily create reports for different target groups using one database. For example, quality management may be primarily interested in visualizing detailed processes, whereas the top management needs condensed information for strategic issues. Both can be obtained automatically from the same Knowledge Graph. LEONI is therefore able to provide different target groups with individual analyzes based on one database, without using complicated report solutions. It is also possible to create visualizations based on virtual nodes and relationships that are calculated at runtime. This allows completely new graphical evaluations that are not included in the raw data provided by the connected data sources (e.g. aggregated data-application flowcharts).
Conclusion
With the help of the Knowledge Graph build within Neo4j, LEONI creates an information base that enables integrated evaluations, reports and visualizations, independent of the individual notations and formats of the data providing tools. It turns out that the NoSQL graph database overcomes the limitations of the connected tools. An additional positive effect is achieved through the use of open-source solutions, which make it possible to control software cost effectively and reduces the dependence on tool providers. The effort required for technical integration is low and can be easily achieved based on the standardization of the associated technology. It turns out that consolidating strategic and operational architectural content in a graph is particularly recommended when transparency needs to be gained quickly, sustainably and cost-effectively in a heterogeneous, dynamic environment.